
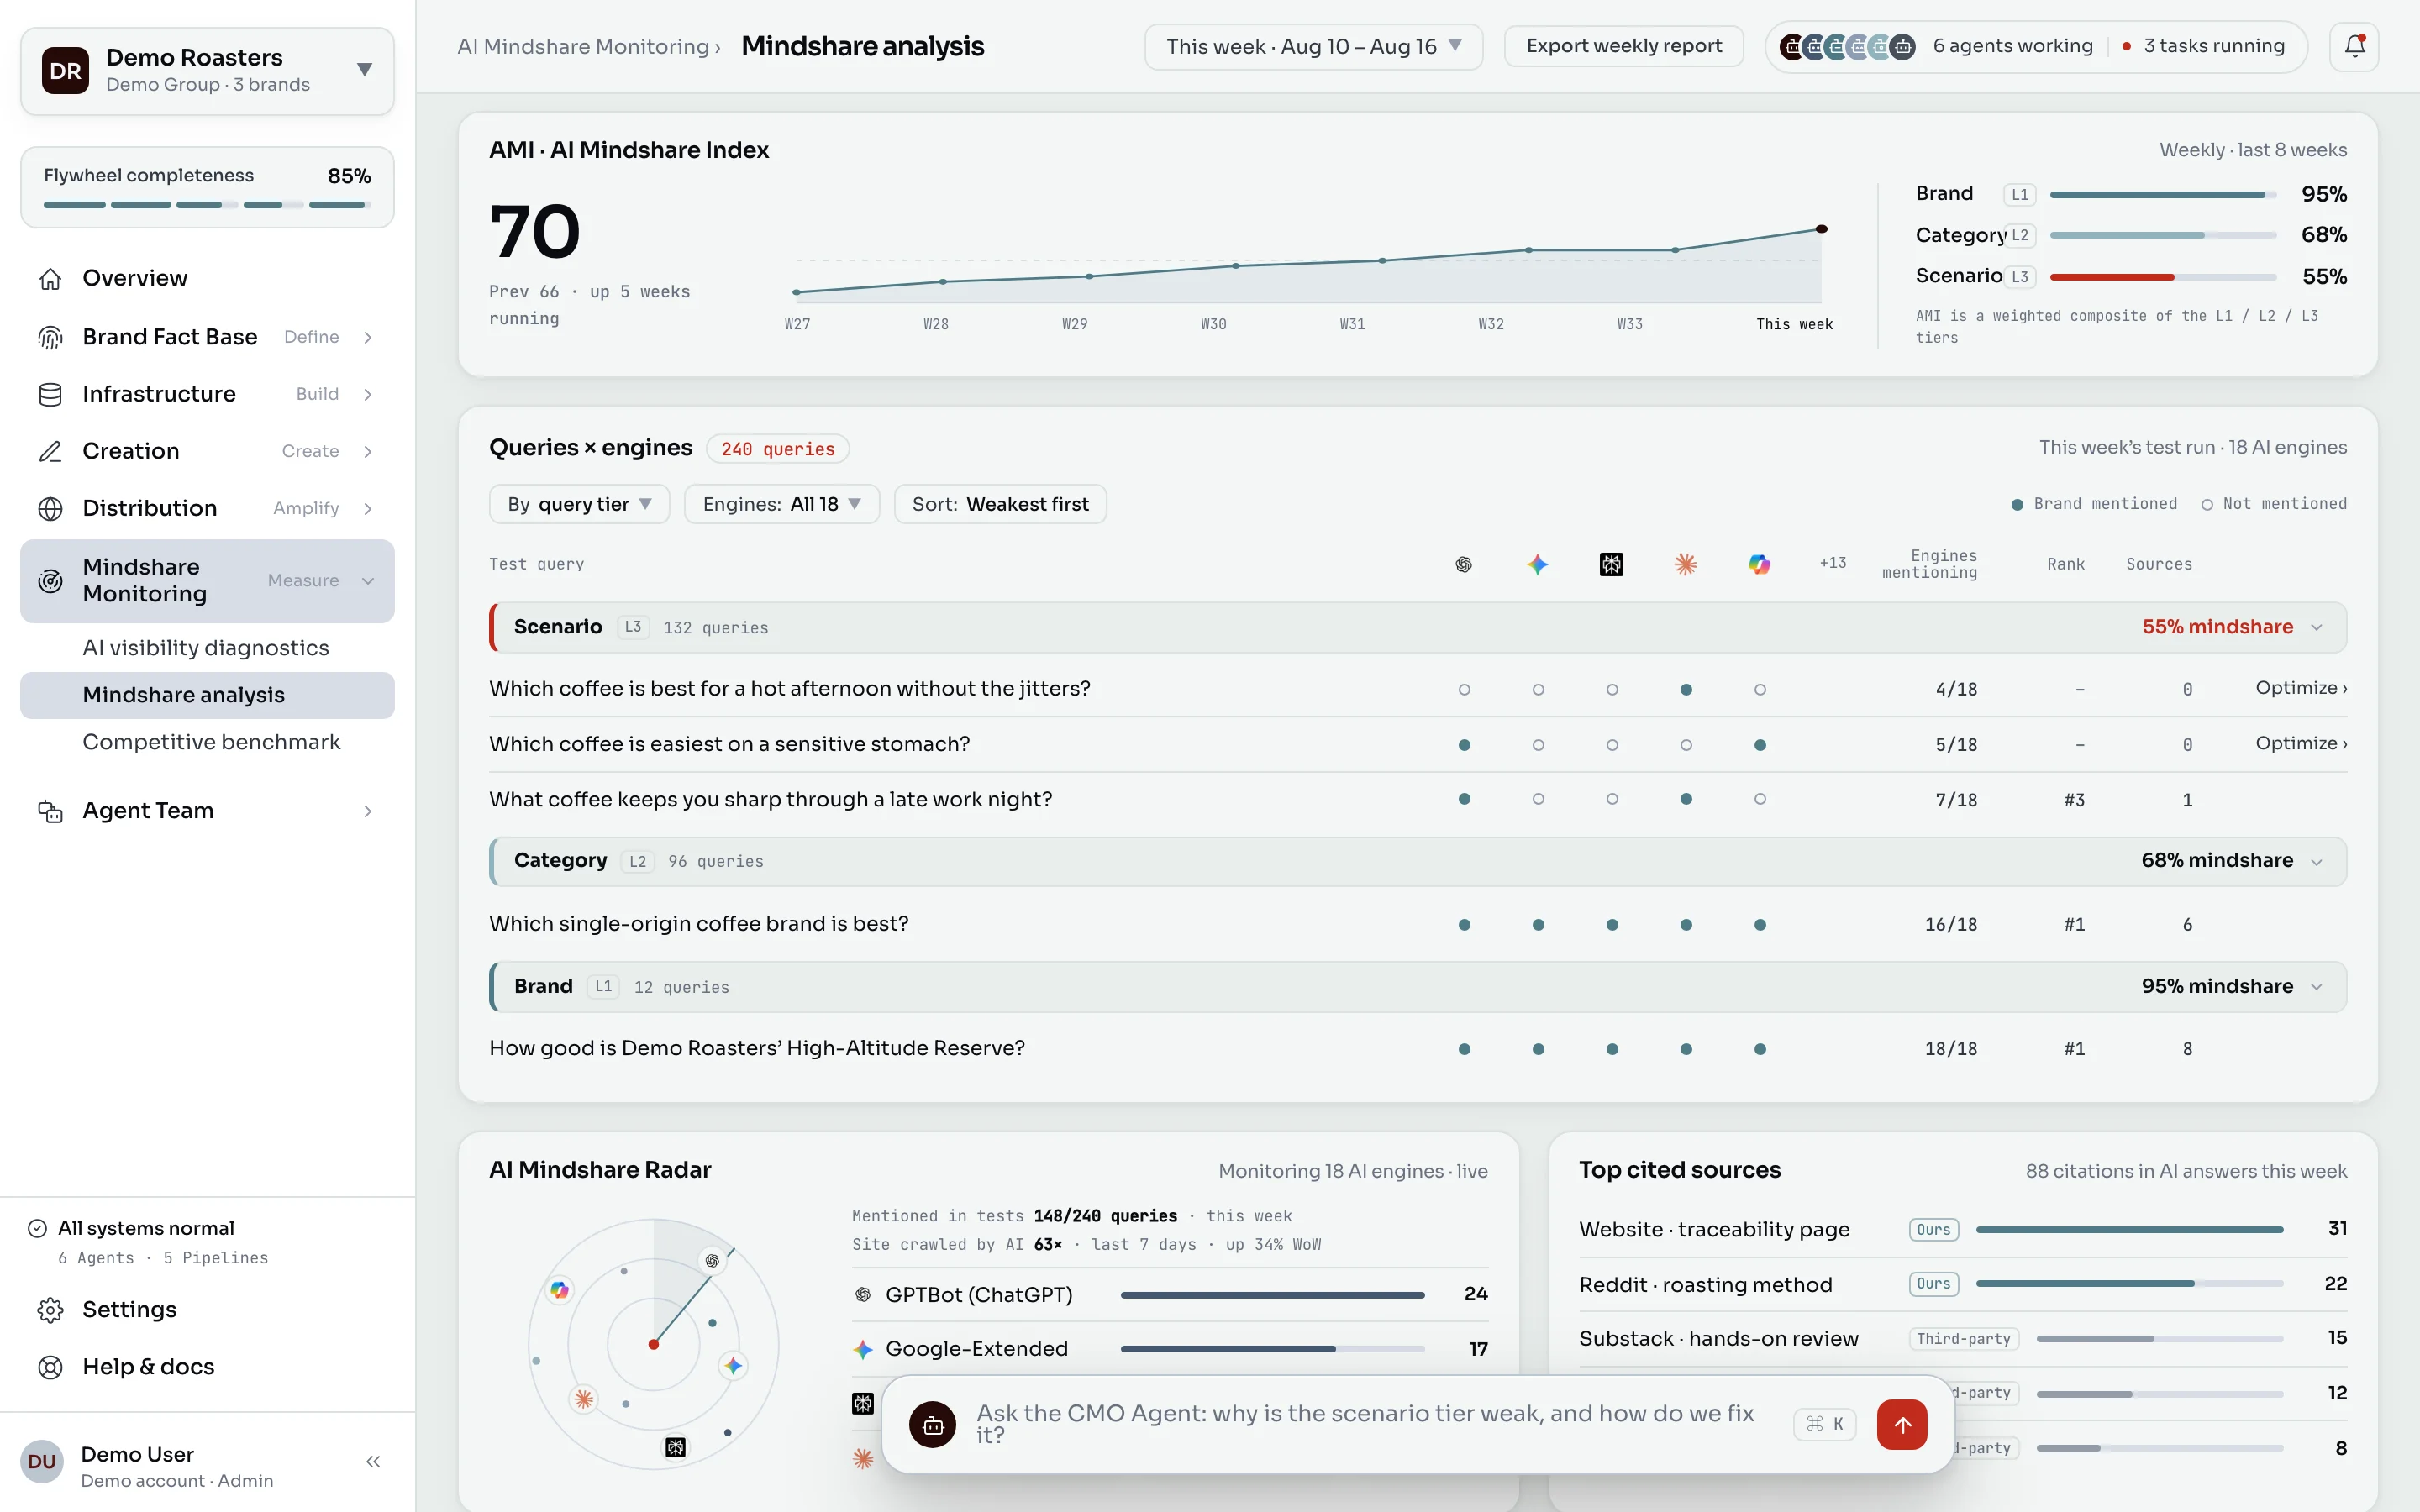
AMI (AI Mindshare Index) is a composite score for how a brand stands in AI answers: mindshare is stress-tested separately at the brand (S1), category (S2), and scenario (S3) question stages, then weighted into a single 0–100 number you can track over time and compare against peers.
Also known as AI Mindshare Index · Mindshare Index
What one number is for
AI recommendation rate and fact citation rate are each clear enough, but they measure single points. What a brand actually wants to know is something broader: where do I stand in AI’s understanding right now, and is that better or worse than last week?
A scattered set of rates can’t answer that. AMI exists to collapse them into one trackable, comparable number.
Three question stages
AMI doesn’t average every query together. Queries are first sorted by what the question is actually asking for, scored per stage, then weighted.
| Question stage | What the query looks like | Typical situation behind it |
|---|---|---|
| S1 Brand | “How good is X?” “Is X any good?” | Someone already knows you and is checking |
| S2 Category | “Which brand is best for this?” “A or B?” | Someone knows what they want, picking who |
| S3 Scenario | “I have this problem, what should I do?” | Someone has a need and no category in mind |
The point of splitting them is that difficulty runs in the opposite direction to what you’d expect.
The brand stage is easiest: the query named you, so AI will usually say something. Scoring above 90% there is normal and proves little. The scenario stage is hardest: the query never mentions a category, so AI has to decide what kind of answer fits before deciding who to name. And the scenario stage is where the query volume is, and where new customers come from.
A brand that only scores well at the brand stage gets pulled down by AMI, honestly. That’s the entire point of separating them: don’t let the easy part hide the real gap.
These stages weren’t invented for the index. Every vertical in the industry guides sorts its real query set the same way, and the stress-test seeds come straight from there.
How it’s measured
Queries are run anonymously at volume, mentions are counted, results are grouped by stage and weighted. The essentials match how recommendation rate is measured:
- Fixed query set. Once the baseline is set, it doesn’t change. Change it and comparison breaks.
- Anonymous. No identifying signals in the session, so personalization doesn’t contaminate results.
- Multiple LLMs. Chinese and global platforms both covered; one platform’s noise isn’t the picture.
- Consistent cadence. Same conditions each round. You’re reading a trend, not a snapshot.
Where it stops
AMI is an index Daimonia defined and uses. It isn’t an industry standard and shouldn’t be treated as an authoritative score. Its value is a consistent, checkable, trackable methodology, not the number looking good.
For the same reason, comparing AMI across categories is meaningless. Query sets differ wildly in difficulty between industries. Two brands in different sectors comparing AMI values are measuring the gap between their categories, not between themselves.
Related: Brand visibility and fact citation rates · What AI answer visibility is · What A2A Marketing is
How does AMI relate to AI recommendation and fact citation rates?
Those two are the raw rates: does AI mention you, and does AI cite your content. AMI sits on top of them. The query set is split into brand, category, and scenario question stages, each stage's mindshare is calculated separately, and the results are weighted into one number. The rates measure specific points; AMI measures overall standing.
Why split into three question stages instead of one overall recommendation rate?
Because the three stages differ enormously in difficulty and value. Brand-stage queries (someone asks about you by name) are easy to score well on; hitting 95% there proves little. Scenario-stage queries, where someone describes a need without naming a category, are the hard ones and the source of new customers. Blended into a single figure, the easy stage hides the real gap.
What counts as a good AMI score?
As with recommendation rate, there's no universal benchmark. Category competitiveness, query-set definition, and market maturity all move the absolute number. The useful approach is to set a baseline, then watch your own week-over-week movement and your relative position against peers on the same query set. Anyone promising a guaranteed score is overselling.
Is this an industry standard?
No. AMI is an index Daimonia defined and uses. Daimonia publishes the composition and measurement method so clients can verify the result.